CASE STUDY
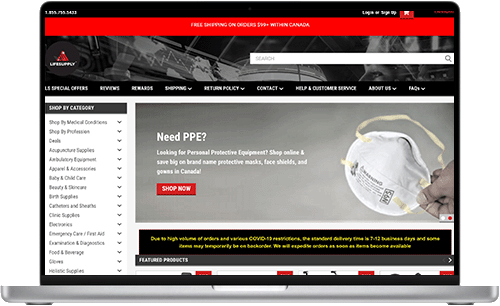
Life Supply Medical
E-Commerce Store
PROJECT SUMMARY
The client was running a Google shopping campaign, but due to the high number of SKUs, the product feed needed to be better optimized, and brands needed to be segmented. The challenge was to optimize the product feed and improve product visibility on Google Shopping.
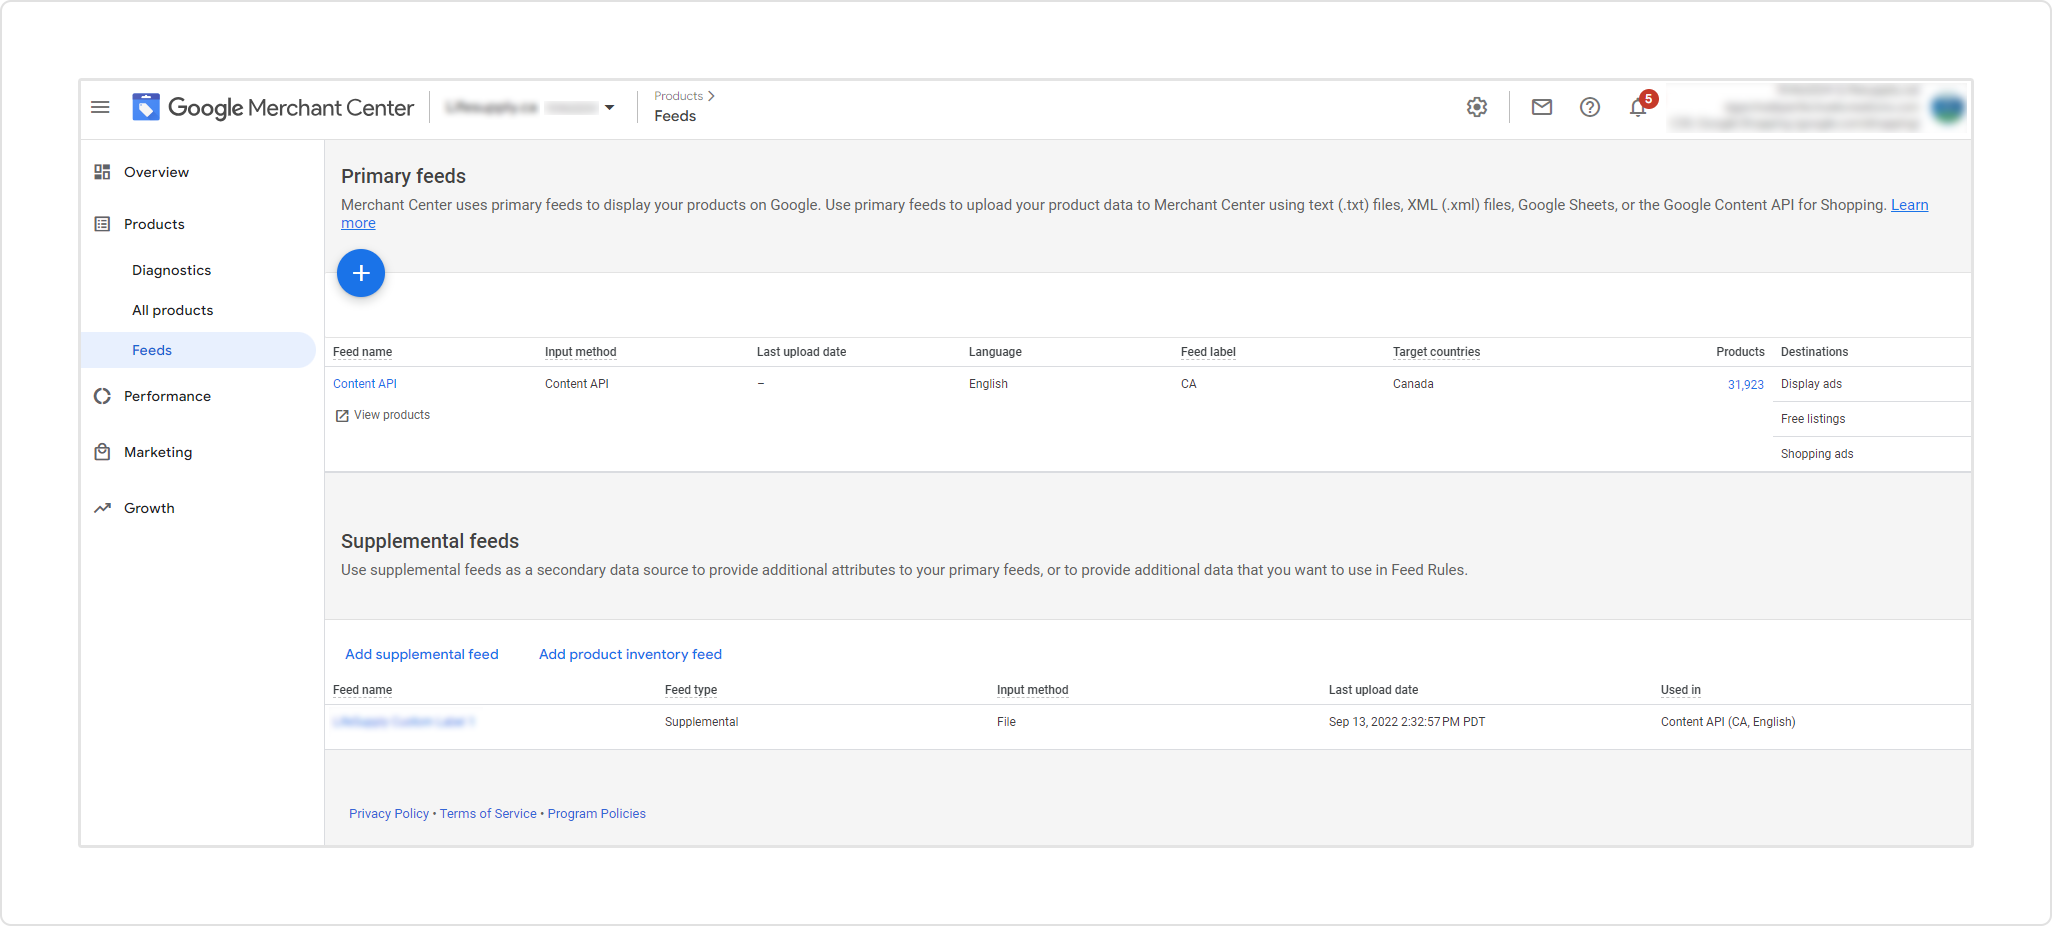
We optimized their product feed that was managed in Sales & Orders, improved the landing page experience, segmented the products/brands, and optimized the shopping campaign.
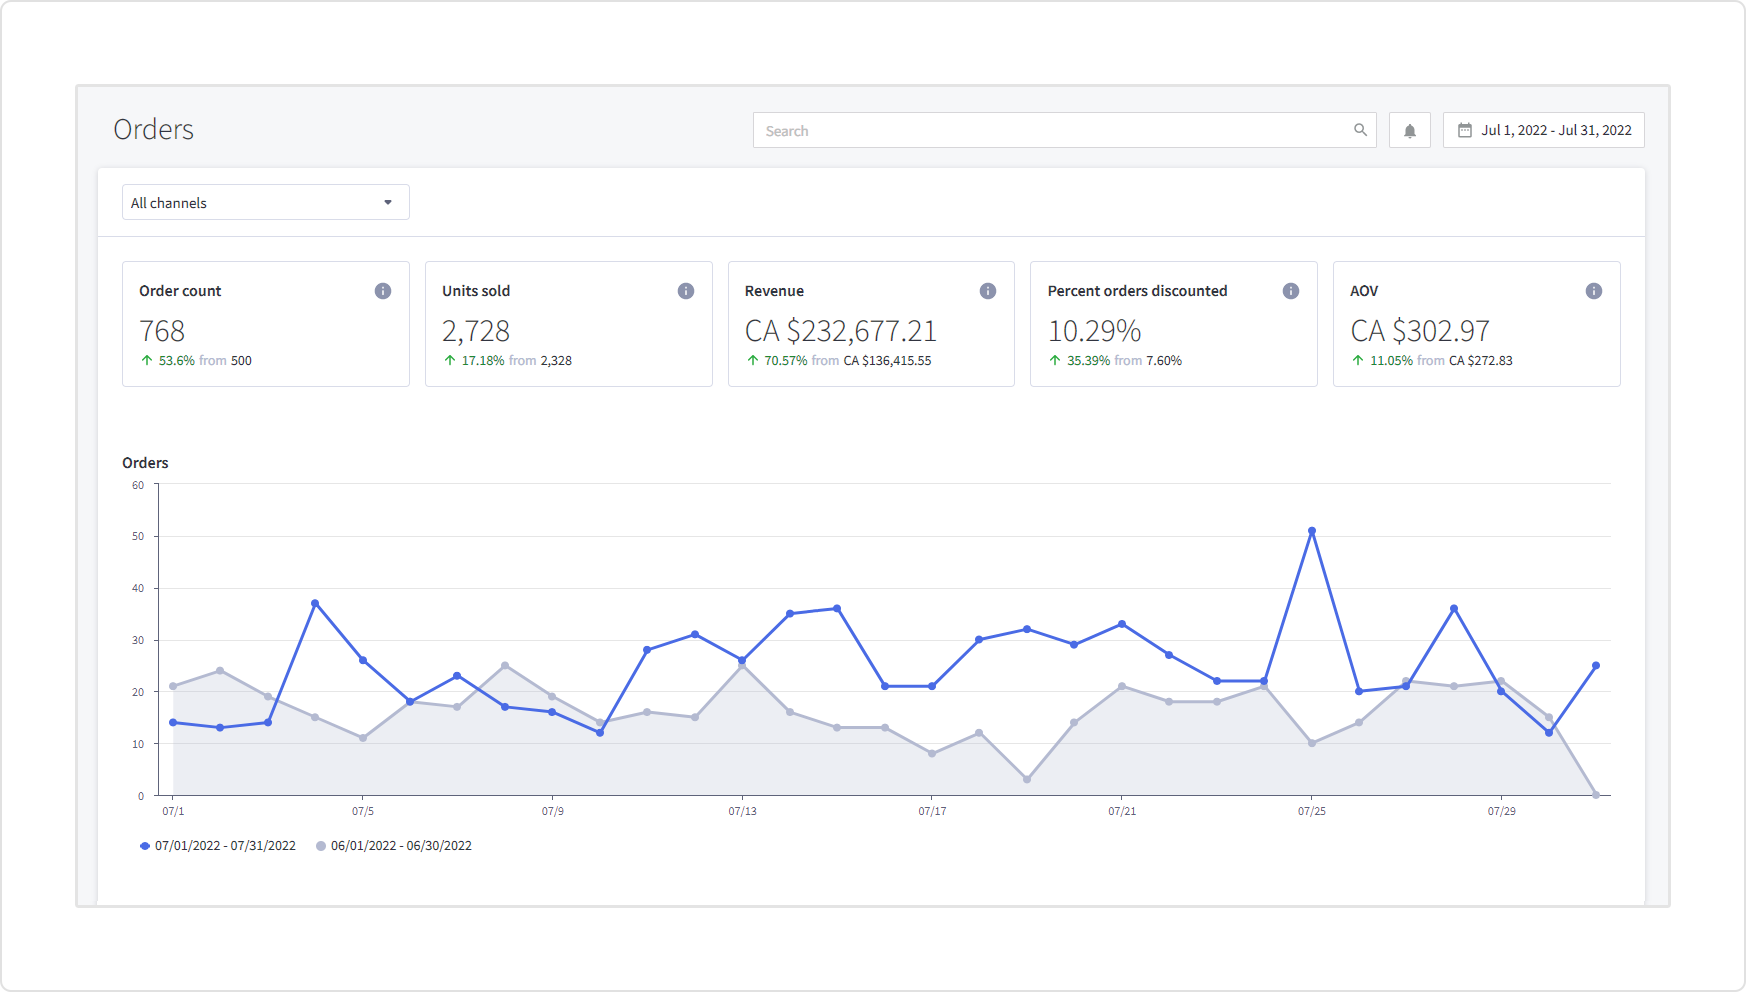
Within the record time of one month, we increased their Google shopping sales by 70% compared to the previous month.

ABOUT THE COMPANY
About Life Supply
Life Supply is an e-commerce store and medical and healthcare equipment supplier in Canada. They are operated by Wellmart Health Supplies Ltd., one of Canada’s leading online retailers of medical and health-related products. They provide patients, caregivers, and medical professionals with convenient access to a wide selection of home medical products at some of the lowest prices in Canada. LifeSupply offers some of the lowest prices on an expanding range of mobility aids (scooters, power wheelchairs, transport chairs, wheelchairs, walkers, canes, crutches, etc.), commodes, bathroom safety, patient room supplies, pressure prevention, dental, ostomy, wound care, emergency care, needles, syringes, beauty, spa, and other products.
Services Provided:
- Marketing Strategy
- Google Ads & Bing Ads
- Google Shopping Ads
- Adroll
Merchant Center Product Feed
Product Feed Optimization
From our experience working with Google Shopping over the years, we learned that product feed optimization is crucial to achieving great performance. Proper categorization, using the right keywords in the copy, using GTIN/UPCs, and feed segmenting are all part of the process. One of our favorite optimization methods is the specialized use of custom labels, in which we divide items by price level, seasonality, offers, or bestsellers.
Shopping Ads
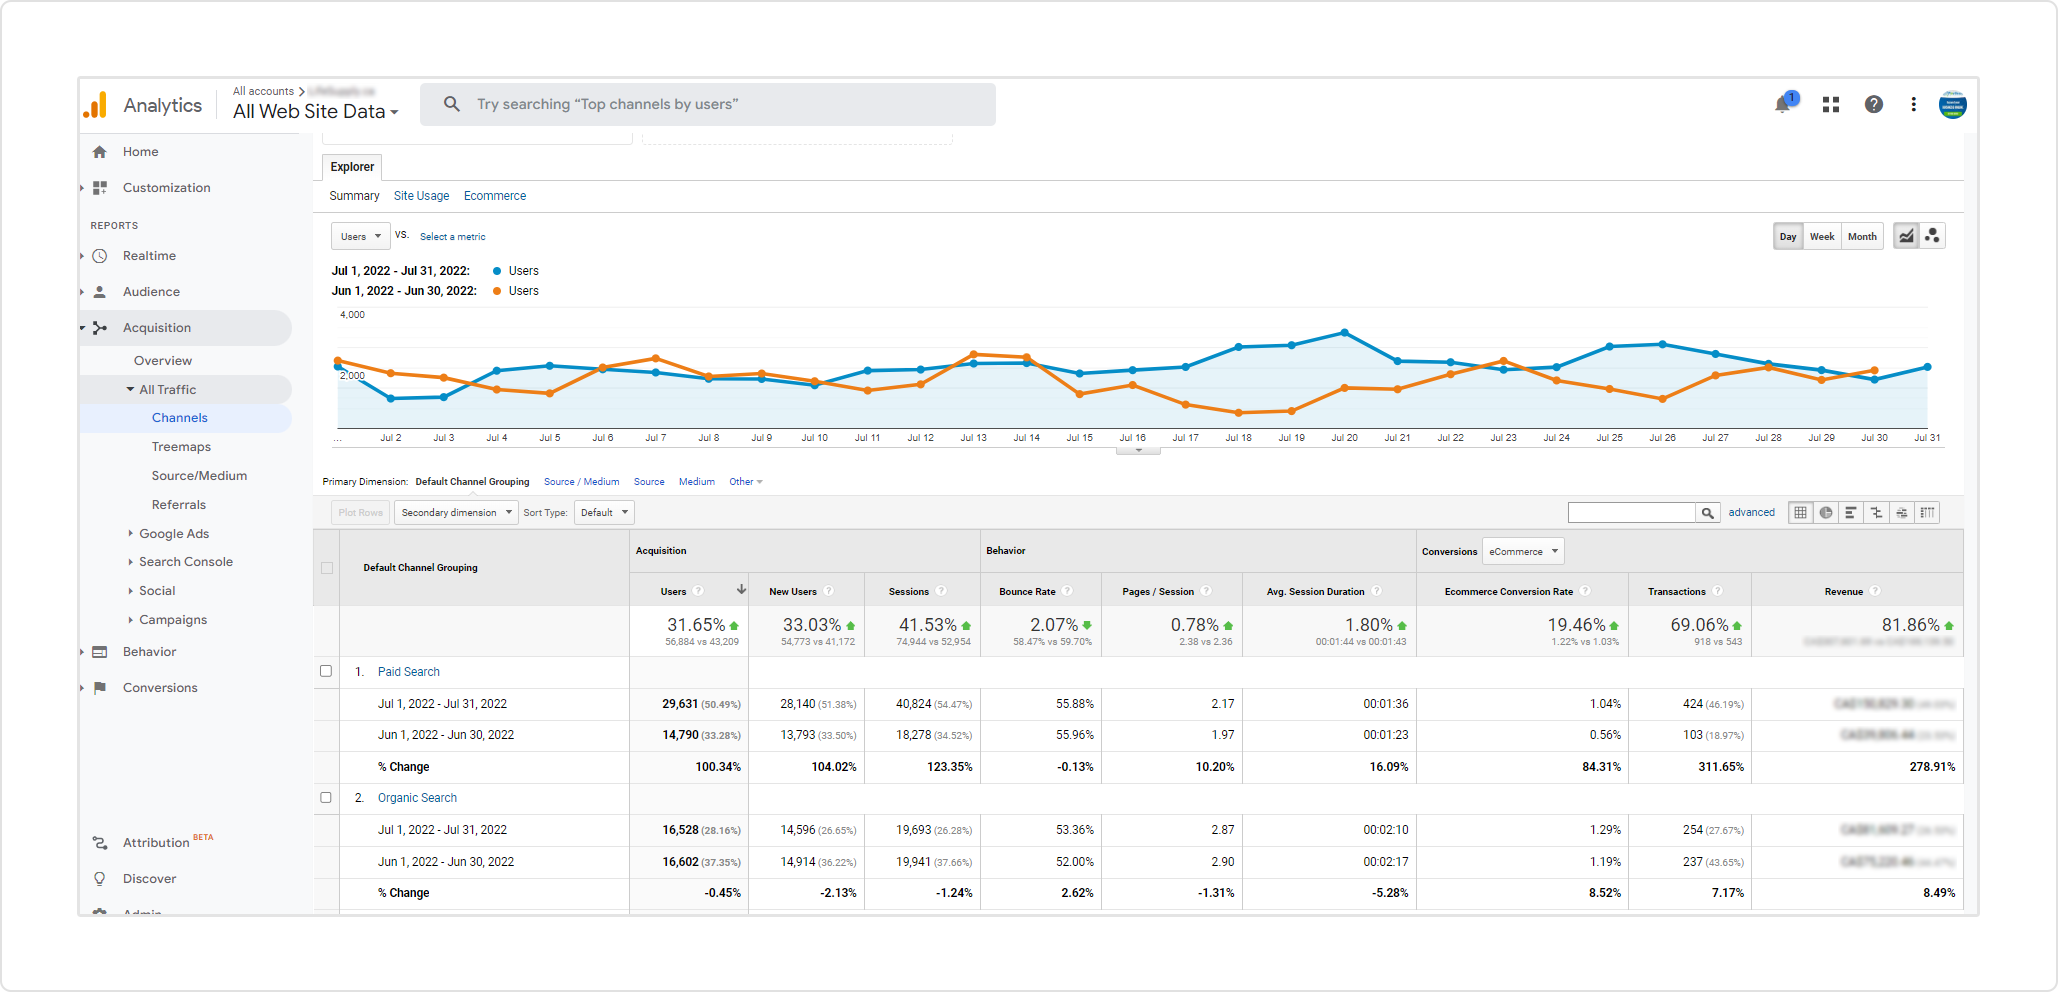
Google Ads Campaign
Smart Shopping campaigns on Google are a great way to get the right products in front of the right shoppers, and they work even better when you back them up with content marketing on your website and beyond. Our client wanted to optimize the product landing experience with updated descriptions and engage new customers on the website to drive sales through Google Shopping ads. They wanted relevant Google ads and product details to encourage the customers throughout the purchase journey.
The Google Shopping ads from June to July 2022 proved to be very successful in improving sales. Compared to the previous months, the client witnessed a ROAS of 7x, and revenue increased by 70% just in one month.
Retargeting Ads
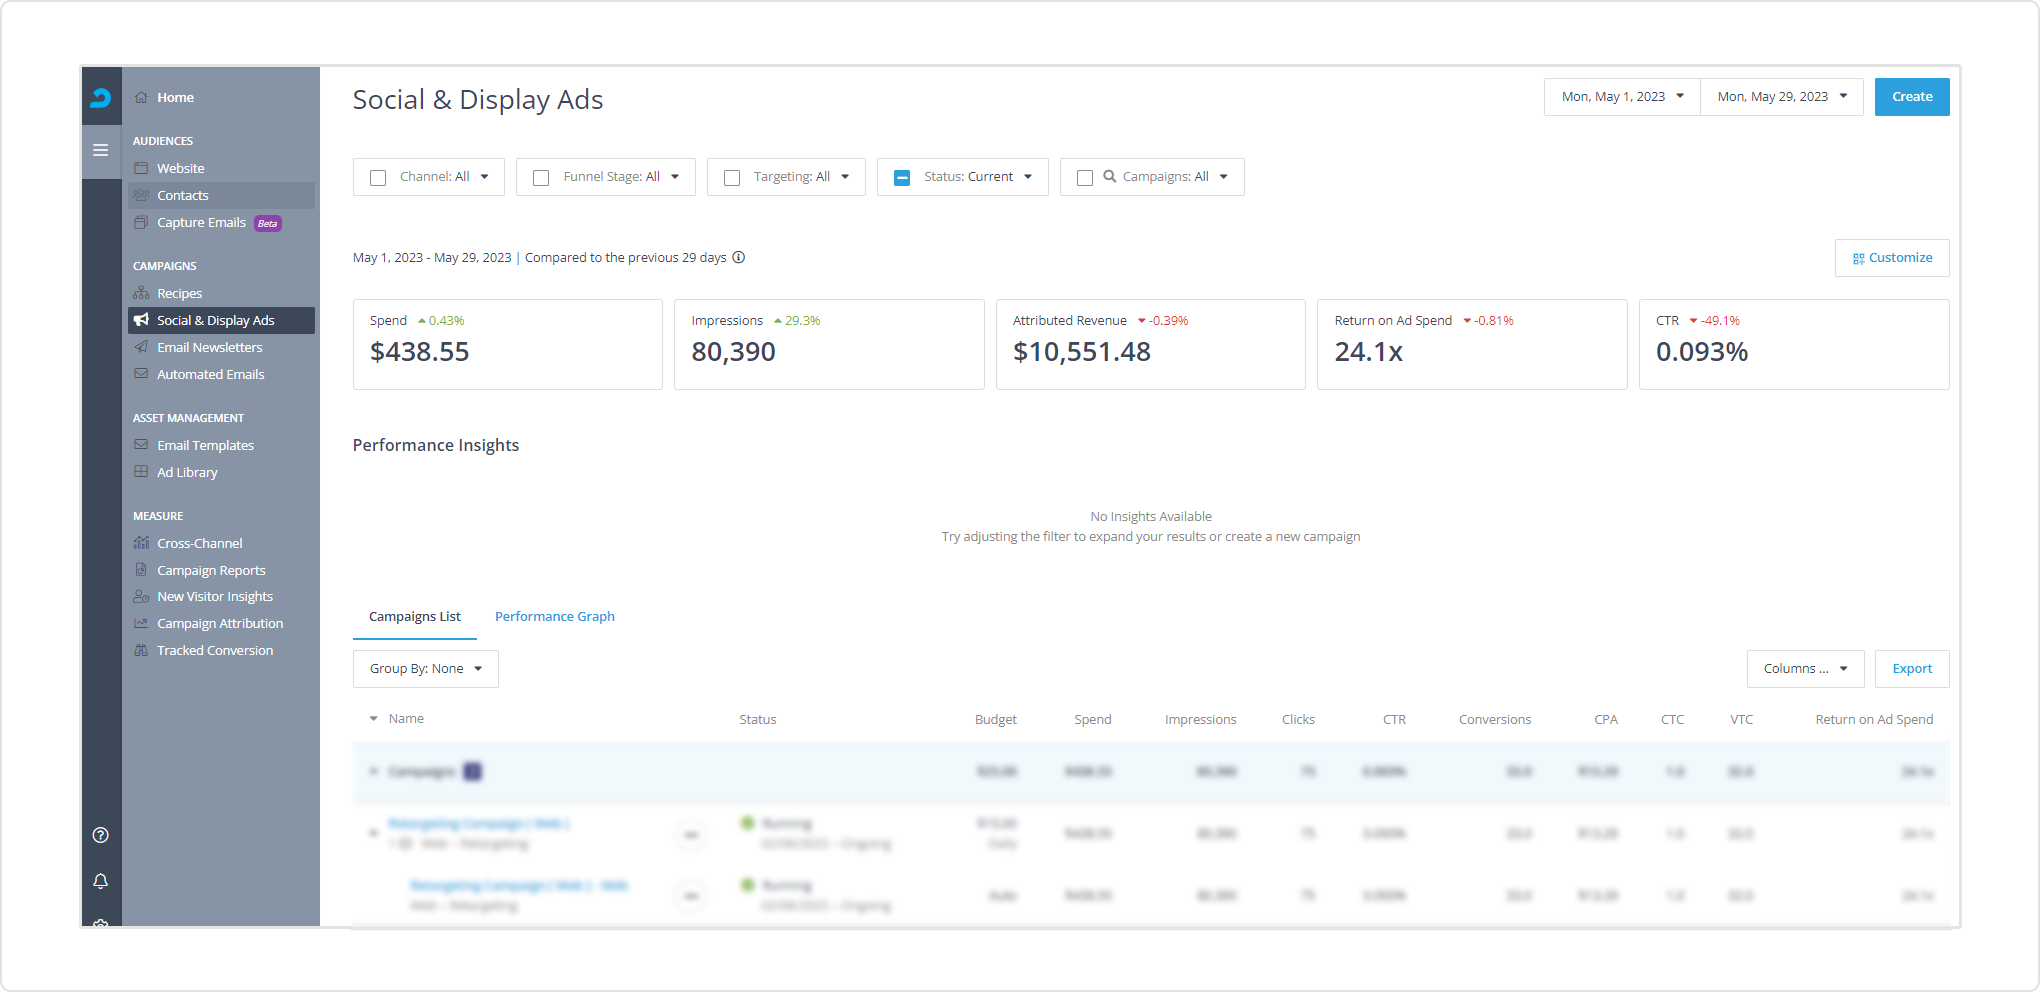
Adroll Campaign
One strategy we’ve found consistently effective and affordable for e-commerce client selling products is product-based retargeting with AdRoll. AdRoll places your ads across various exchanges, such as Google, AppNexus, AOL, Yahoo, and Taboola. With retargeting, we helped Life Supply show product ads to people who have previously interacted with the website and who have shown some level of interest in the company. Not only did Life Supply see an uplift in site visitors, but they also saw an increased performance in their existing retargeting campaigns. The ROI for their retargeting campaigns increased by 64%, and their retargeting CTRs have increased by 35%.
NUMBERS THAT MATTER
Quick Statistics
Some highlights include:
- Our click-through rate has increased to 2.14% from 1.16%.
- The average cost per click has decreased to $10.74 from $21.83.
- The average order value (AOV) increased by 28.78% from CA $196.33 to CA $252.83.
- YoY annual revenue increased by 22.85% as compared to the previous year.


